Chart - Category
Display the different type on category chart based on configuration. It will allow to group a data metric and time series and show a data based on grouping.
Attributes
tile=chartCategorytitle: Title of chart componentconnect: [Array of objects]Provide a Data connection objectsdisplay: [Display charts according to the Screen size]span: mobile viewdspan: desktop viewtspan: tablet view
chart: Any configuration related to charttimeSeries: time series expression;single: true (if single value)groupBy: metric or $usergroupBySort: sorting grouped data.titlec3:[object] Provide a chart options based on requirements for that follow this one https://c3js.org/reference.htmldata.type: bar | line | splineaxis.x.tick.format: Any format specifieraxis.y2.show: Want to show the y2 axis or notetc..
EXAMPLE - 1
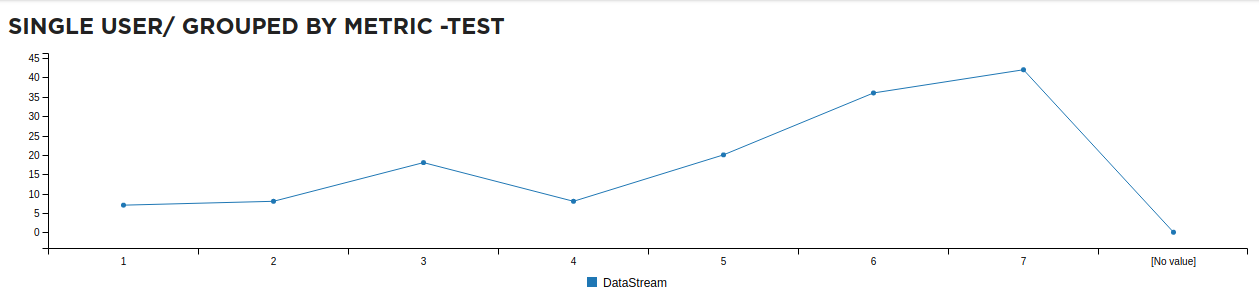
- The below chart represent the single user details with grouped tracker metric. For example here grouping metric is "sleep".
Sample Code
 {
      "tile": "chartCategory",
      "display": {
        "span": "12"
      },
      "chart": {
        "title": "Values by day",
        "groupBy": "sleep",
        "c3": {
          "data.type": "line",
          "size.height": 250,
          "axis.y.show": true,
          "axis.x.tick.format": "%b-%d",
          "legend.show": true
        }
      },
      "connect": [
        {
          "title": "DataStream",
          "source": "current-general",
          "pick": "values.sleep",
          "apply": "sum(ls)",
          "format": "0,0",
          "tableData": {
            "id": 0
          }
        }
      ],
      "title": "single user/ grouped by metric -test"
}
DataSources Config
{
  "dataSources": [
    {
      "id": "current-general",
      "query": "current user, given tracker [chart-testing] from 2021-12-01 to 2022-02-25"
    }
  ]
}
EXAMPLE - 2
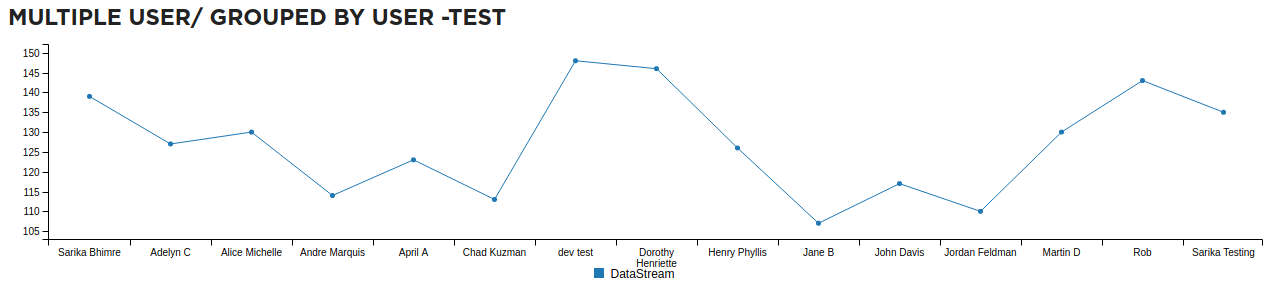
- The below chart represent the multiple user details with grouped by user. For example here grouping is based on "$user".
Sample Code
{
  "tile": "chartCategory",
  "display": {
    "span": "12"
  },
  "chart": {
    "title": "Values by day",
    "groupBy": "$user",
    "c3": {
      "data.type": "line",
      "size.height": 250,
      "axis.y.show": true,
      "axis.x.tick.format": "%b-%d",
      "legend.show": true
    }
  },
  "connect": [
    {
      "title": "DataStream",
      "source": "general",
      "pick": "values.sleep",
      "apply": "sum(ls)",
      "format": "0,0",
      "tableData": {
        "id": 0
      }
    }
  ],
  "title": "multiple user/ grouped by user -test"
}
DataSources Config
{
  "dataSources": [
    {
      "id": "general",
      "query": "given tracker[chart-testing] from 2021-12-01 to 2022-02-25"
    }
  ]
}