Chart - Scatter
Display a charts by not reduced the data for specific axis point.It means allow multiple data points for specific axis label for specific user = [one user have an multiple data points].
Attributes
tile=chartScattertitle: Title of chart componentconnect: [Array of objects]Provide a Data connection objectschart: Any configuration related to charttimeSeries: expression;groupBy: metric or $usertitlec3:[object] Provide a chart options based on requirements for that follow this one https://c3js.org/reference.htmldata.type: scatter | bar | lineaxis.x.tick.format: Any format specifieraxis.y2.show: Want to show the y2 axis or notetc..
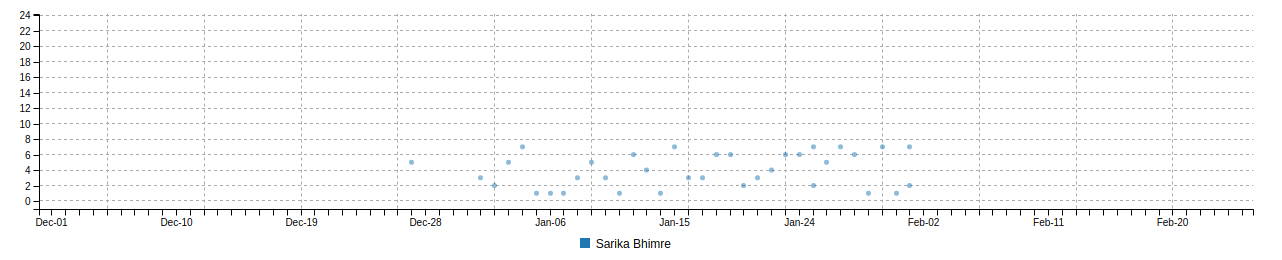
EXAMPLE - 1
- The below chart represent the single user details with multiple data points on specific axis.
Sample Code
{
  "tile": "chartScatter",
  "title": "Attack Graph",
  "display": {
    "span": "12",
    "dSpan": 12
  },
  "chart": {
    "timeSeries": "YYYY-MM-DD; YYYY-MM-DD; P1D; day",
    "title": "Attack Data",
    "groupBy": "$user",
    "c3": {
      "data.type": "scatter",
      "size.height": 250,
      "xxxdata.labels": true,
      "axis.x.tick.format": "%b-%d",
      "point.show": true,
      "grid.x.show": "true",
      "grid.y.show": "true",
      "legend.show": "true",
      "axis.y.min": 1,
      "axis.y.max": 22,
      "xxxcolor.pattern": [
        "#1e90ff"
      ]
    }
  },
  "connect": [
    {
      "title": "発作",
      "source": "current-general",
      "pick": "values.sleep",
      "format": "0,0",
      "condition": "values.sleep exists",
      "tableData": {
        "id": 0
      }
    }
  ]
}
DataSources Config
{
  "dataSources": [
    {
      "id": "current-general",
      "query": "current user, given tracker [chart-testing] from 2021-12-01 to 2022-02-25"
    }
  ]
}
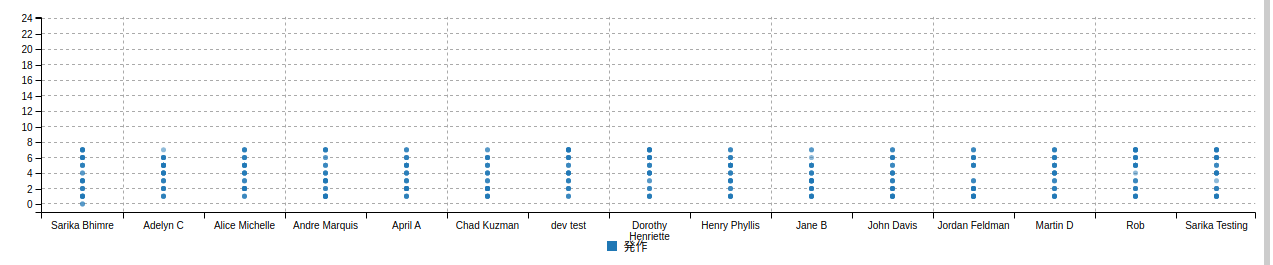
EXAMPLE - 2
- The below chart represent the multiple user details with multiple data points on specific axis with grouping by users.
Sample Code
{
  "tile": "chartScatter",
  "title": "Test Graph",
  "display": {
    "span": "12",
    "dSpan": 12
  },
  "chart": {
    "title": "Test Data",
    "groupBy": "$user",
    "type": "category",
    "c3": {
      "axis.x.type": "category",
      "data.type": "scatter",
      "size.height": 250,
      "xxxdata.labels": true,
      "point.show": true,
      "grid.x.show": "true",
      "grid.y.show": "true",
      "legend.show": "true",
      "axis.y.min": 1,
      "axis.y.max": 22,
      "xxxcolor.pattern": [
        "#1e90ff"
      ]
    }
  },
  "connect": [
    {
      "title": "発作",
      "source": "general",
      "pick": "values.sleep",
      "format": "0,0",
      "condition": "values.sleep exists",
      "tableData": {
        "id": 0
      }
    }
  ]
}
DataSources Config
{
  "dataSources": [
    {
      "id": "general",
      "query": "given tracker[chart-testing] from 2021-12-01 to 2022-02-25"
    }
  ]
}
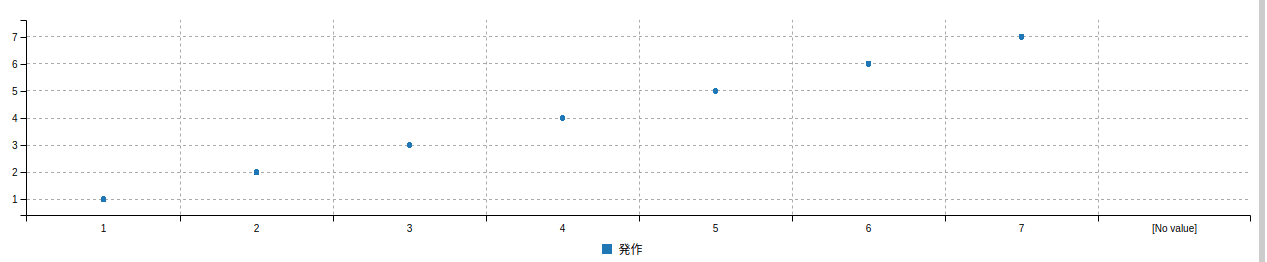
EXAMPLE - 3
- The below chart represent the multiple user details with multiple data points on specific axis with grouping by metric.
Sample Code
 {
  "tile": "chartScatter",
  "title": "Attack Graph",
  "display": {
    "span": "12",
    "dSpan": 12
  },
  "chart": {
    "title": "Attack Data",
    "groupBy": "sleep",
    "type": "category",
    "c3": {
      "axis.x.type": "category",
      "data.type": "scatter",
      "size.height": 250,
      "xxxdata.labels": true,
      "point.show": true,
      "grid.x.show": "true",
      "grid.y.show": "true",
      "legend.show": "true",
      "axis.y.min": 1,
      "xxxcolor.pattern": [
        "#1e90ff"
      ]
    }
  },
  "connect": [
    {
      "title": "発作",
      "source": "general",
      "pick": "values.sleep",
      "format": "0,0",
      "condition": "values.sleep exists",
      "tableData": {
        "id": 0
      }
    }
  ]
}
DataSources Config
{
  "dataSources": [
    {
      "id": "general",
      "query": "given tracker[chart-testing] from 2021-12-01 to 2022-02-25"
    }
  ]
}