Chart - Time series
Display the different type on time series chart based on configuration. It will display the data point in chart if it consists the 0 or empty value for specific axis.
Attributes
tile=charttitle: Title of chart componentconnect: [Array of objects]Provide a Data connection objectsdisplay: [Display charts according to the Screen size]span: mobile viewdspan: desktop viewtspan: tablet view
chart: Any configuration related to charttimeSeries: time series expression;single: true (if single value)groupBy: metric or $usertitlec3:[object] Provide a chart options based on requirements for that follow this one https://c3js.org/reference.htmldata.type: bar | line | splineaxis.x.tick.format: Any format specifieraxis.y2.show: Want to show the y2 axis or notetc..
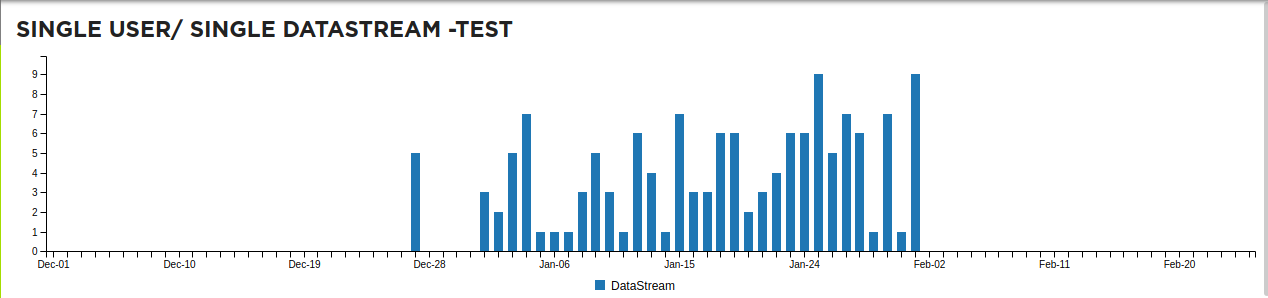
EXAMPLE - 1
- The below chart represent the single user details with single datasource in y axis.
Sample Code
{
  "tile": "chart",
  "display": {
    "span": "12"
  },
  "chart": {
    "title": "Values by day",
    "timeSeries": "YYYY-MM-DD; YYYY-MM-DD; P1D",
    "c3": {
      "data.type": "bar",
      "size.height": 250,
      "axis.y.show": true,
      "axis.x.tick.format": "%b-%d",
      "legend.show": true,
      "grid.y.lines[0].value": "50"
    }
  },
  "connect": [
    {
      "title": "DataStream",
      "source": "testing-general",
      "pick": "values.sleep",
      "apply": "sum(ls)",
      "format": "0,0",
      "tableData": {
        "id": 0
      }
    }
  ],
  "title": "single user/ single DataStream  -test"
}
DataSources Config
{
  "dataSources": [
    {
      "id": "testing-general",
      "query": "current user, given tracker[chart-testing] from 2021-12-01 to 2022-02-25"
    }
  ]
}
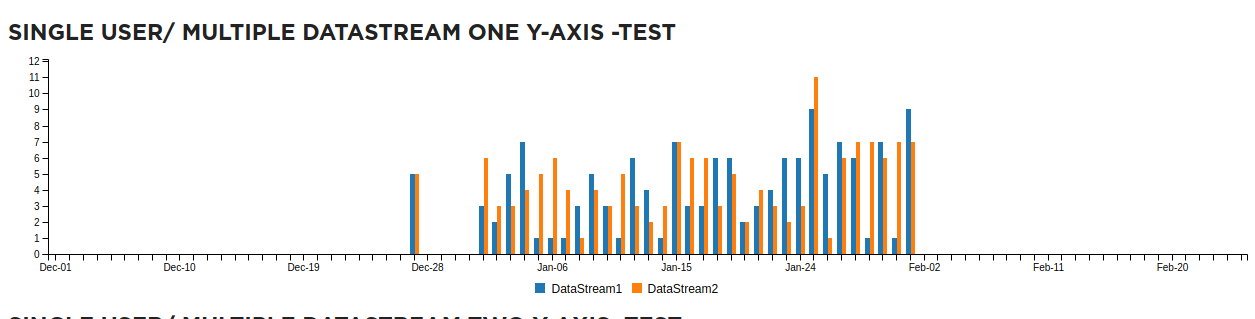
EXAMPLE - 2
- The below chart represent the single user details with multiple datasource in single y axis.
Sample Code
{
      "tile": "chart",
      "display": {
        "span": "12"
      },
      "chart": {
        "title": "Values by day",
        "timeSeries": "YYYY-MM-DD; YYYY-MM-DD; P1D",
        "c3": {
          "data.type": "bar",
          "size.height": 250,
          "axis.y.show": true,
          "axis.x.tick.format": "%b-%d",
          "legend.show": true,
          "grid.y.lines[0].value": "50"
        }
      },
      "connect": [
        {
          "title": "DataStream1",
          "source": "testing-general",
          "pick": "values.sleep",
          "apply": "sum(ls)",
          "format": "0,0",
          "tableData": {
            "id": 0
          }
        },
        {
          "title": "DataStream2",
          "source": "testing-general",
          "pick": "values.stress",
          "apply": "sum(ls)",
          "format": "0,0",
          "tableData": {
            "id": 0
          }
        }
      ],
      "title": "single user/ Multiple DataStream one y-axis -test"
}
DataSources Config
{
  "dataSources": [
    {
      "id": "testing-general",
      "query": "current user, given tracker[chart-testing] from 2021-12-01 to 2022-02-25"
    }
  ]
}
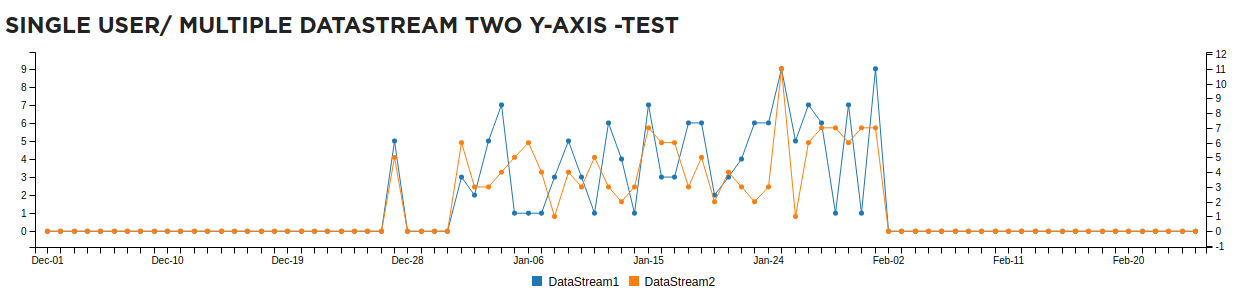
EXAMPLE - 3
- The below chart represent the single user details with multiple datasource in two y axis || [Datasource refer two different y-axis].
Sample Code
{
  "tile": "chart",
  "display": {
    "span": "12"
  },
  "chart": {
    "title": "Values by day",
    "timeSeries": "YYYY-MM-DD; YYYY-MM-DD; P1D",
    "c3": {
      "data.type": "line",
      "size.height": 250,
      "axis.y2.show": true,
      "axis.x.tick.format": "%b-%d",
      "legend.show": true,
      "grid.y.lines[0].value": "50",
      "data.axes": {
        "d0": "y",
        "d1": "y2"
      }
    }
  },
  "connect": [
    {
      "title": "DataStream1",
      "source": "testing-general",
      "pick": "values.sleep",
      "apply": "sum(ls)",
      "format": "0,0",
      "tableData": {
        "id": 0
      }
    },
    {
      "title": "DataStream2",
      "source": "testing-general",
      "pick": "values.stress",
      "apply": "sum(ls)",
      "format": "0,0",
      "tableData": {
        "id": 0
      }
    }
  ],
  "title": "single user/ Multiple DataStream two y-axis -test"
}
DataSources Config
{
  "dataSources": [
    {
      "id": "testing-general",
      "query": "current user, given tracker[chart-testing] from 2021-12-01 to 2022-02-25"
    }
  ]
}
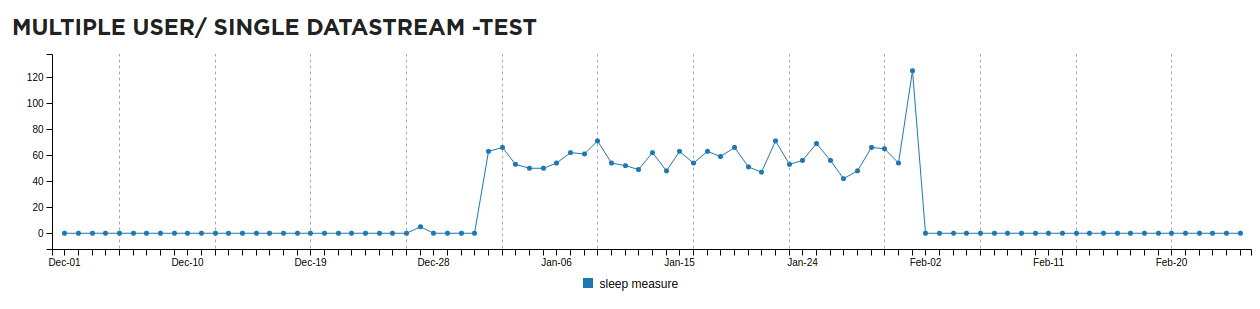
EXAMPLE - 4
- The below chart represent the multiple user details with single datasource in y axis.
Sample Code
 {
  "tile": "chart",
  "title": "MULTIPLE USER/ SINGLE DATASTREAM -TEST",
  "display": {
    "span": "12",
    "dSpan": 12
  },
  "chart": {
    "timeSeries": "YYYY-MM-DD; YYYY-MM-DD; P1D; day",
    "title": "Values by day",
    "c3": {
      "data.type": "line",
      "point.show": true,
      "size.height": 250,
      "axis.y.show": true,
      "xxxdata.labels": true,
      "axis.x.tick.format": "%b-%d",
      "alias.axis.y.tick.format": "0",
      "grid.x.show": "true",
      "legend.show": "true",
      "xxxcolor.pattern": [
        "#1e90ff"
      ]
    }
  },
  "connect": [
    {
      "title": "sleep measure",
      "source": "general",
      "pick": "values.sleep",
      "apply": "sum(ls)",
      "format": "0,0",
      "condition": "values.sleep exists",
      "tableData": {
        "id": 0
      }
    }
  ]
}
DataSources Config
{
  "dataSources": [
    {
      "id": "general",
      "query": "given tracker[chart-testing] from 2021-12-01 to 2022-02-25"
    }
  ]
}
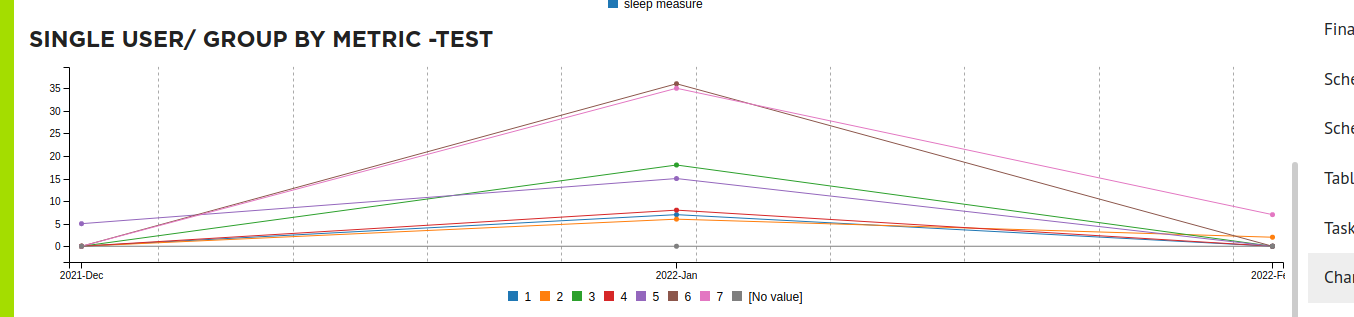
EXAMPLE - 5
- The below chart represent the single user details with group by metric in one y axis.
Sample Code
{
  "tile": "chart",
  "title": "SINGLE USER/ GROUP BY METRIC -TEST",
  "display": {
    "span": "12",
    "dSpan": 12
  },
  "chart": {
    "timeSeries": "YYYY-MM; YYYY-MM-DD; P1M",
    "title": "Values by day",
    "groupBy": "$user, sleep",
    "c3": {
      "data.type": "line",
      "point.show": true,
      "size.height": 250,
      "axis.y.show": true,
      "xxxdata.labels": true,
      "axis.x.tick.format": "%Y-%b",
      "alias.axis.y.tick.format": "0",
      "grid.x.show": "true",
      "legend.show": "true",
      "xxxcolor.pattern": [
        "#1e90ff"
      ]
    }
  },
  "connect": [
    {
      "title": "sleep measure",
      "source": "testing-general",
      "pick": "values.sleep",
      "apply": "sum(ls)",
      "format": "0,0",
      "tableData": {
        "id": 0
      }
    }
  ]
}
DataSources Config
{
  "dataSources": [
    {
      "id": "testing-general",
      "query": "current user, given tracker[chart-testing] from 2021-12-01 to 2022-02-25"
    }
  ]
}
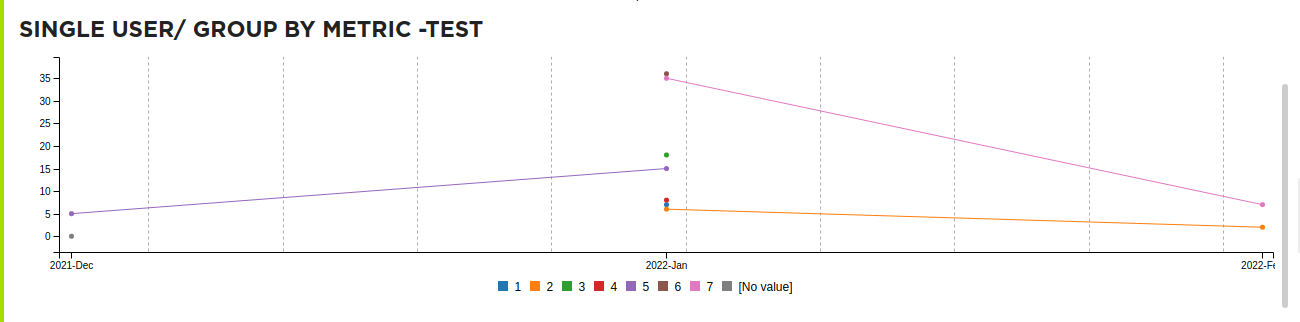
EXAMPLE - 5
- The below chart represent the single user details with group by metric in one y axis.
Sample Code
 {
  "tile": "chartSparse",
  "title": "SINGLE USER/ GROUP BY METRIC -TEST",
  "display": {
    "span": "12",
    "dSpan": 12
  },
  "chart": {
    "timeSeries": "YYYY-MM; YYYY-MM-DD; P1M",
    "title": "Values by day",
    "groupBy": "$user, sleep",
    "c3": {
      "data.type": "line",
      "point.show": true,
      "size.height": 250,
      "axis.y.show": true,
      "xxxdata.labels": true,
      "axis.x.tick.format": "%Y-%b",
      "alias.axis.y.tick.format": "0",
      "grid.x.show": "true",
      "legend.show": "true",
      "xxxcolor.pattern": [
        "#1e90ff"
      ]
    }
  },
  "connect": [
    {
      "title": "sleep measure",
      "source": "current-general",
      "pick": "values.sleep",
      "apply": "sum(ls)",
      "format": "0,0",
      "tableData": {
        "id": 0
      }
    }
  ]
}
DataSources Config
{
  "dataSources": [
    {
      "id": "current-general",
      "query": "current user, given tracker [chart-testing] from 2021-12-01 to 2022-02-25"
    }
  ]
}